
Joel Greenblatt's Forgotten Original Magic Formula
Long before the Little Book That Beats the Market, Joel Greenblatt was busy testing a different magic formula -- one with far better returns.
Did you know that long before Magic Formula investing went mainstream, Joel Greenblatt was developing and testing an even more powerful investment technique?
Joel Greenblatt: A Beautiful (Investment) Mind
Joel Greenblatt has one of the best records on Wall Street. Aside from being an adjunct professor at Columbia University Graduate School of Business, he's also well entrenched in the Hedge Fund industry through his management of Gotham Capital. From 1985 to 2005, Greenblatt is reported to have racked up an even better record than Warren Buffett did during his partnership days, earning 48.5% compounded over 10 years through a combination of special situation and deep value investing.
If you've heard about Joel Greenblatt, it's probably due to his widely read book, "The Little Book That Beats the Market". In it, Greenblatt makes the case for a formula that investors can use to achieve superior results over the long run. Essentially, the formula looks for businesses with a large earnings yield and a high return on capital. The premise is that, over the long run, stocks of firms that are both cheap and good would vastly outperform the stocks of firms that are just cheap -- and it definitely seems to have worked. As Greenblatt reported in his book, from 1988 to 2009 the magic formula produced a CAGR of 23.8% versus a 9.6% CAGR for the S&P 500.
The Original Magic Formula
Joel Greenblatt's love for cheap stocks of good companies started long before he developed his latest Magic Formula, however.
It's probably no surprise that the backbone of Joel Greenblatt's original magic formula rested on Benjamin Graham's net net stocks strategy. Greenblatt had been following Graham for years, carefully studying the principles and philosophies of the Dean of Wall Street, and was deeply impressed by, in his words, "the dramatic success of companies that the market priced below their value in liquidation...".
Benjamin Graham's own NCAV stocks strategy was to buy a diversified list of net net stocks that were trading at least 1/3rd below their net current asset value. Graham screened out stocks that failed to show a decent past record and those that were losing money. By putting together a diversified list, Graham hoped to take advantage of the population returns of net net stocks and ride that fantastic statistical record to great profits.
In 1981, at just 24 years old, Joel Greenblatt teamed up with Richard Pzena (a great value investor in his own right), and Bruce Newberg to test their own version of Graham's NCAV investing approach. The result was a fantastic research paper called, "How the Small Investor Can Beat the Market: By Buying Stocks That Are Selling Below Their Liquidation Value" (The Journal of Portfolio Management 1981.7.4:48-52).
| Defining Net Current Asset Value |
| According to Joel Greenblatt: |
| Current Assets (Cash, Accounts Receivable, Inventory, etc.), less… |
| Current Liabilities (Short Term Debt, Accounts Payable, etc), less… |
| Long Term Liabilities (Long Term Debt, Capitalized leases, etc), less… |
| Preferred Stock (Claims On Corporate Assets Before Common Stock)… |
| Divided by the Number of Shares Outstanding… |
| Equals Liquidating Value Per Share (NCAV Per Share). |
In his paper, Joel Greenblatt wondered what would happen if he carved up the world of net net stocks even further, eliminating a lot of the terrible firms from contention. To do this he turned to one of the most widely recognized valuation metric in value investing: the PE ratio.
Using both Graham's net current asset value and value investing's classic PE ratio, he put together 4 different portfolios and compared those portfolios against the OTC and Value Line's own value index from 1972 to 1978. According to Joel Greenblatt, this period was characterized by an extreme amount of volatility which made for a much more robust test.
To select the stocks, Greenblatt only looked at firms in the Standard and Poor's Stock Guide with market caps of over $3 million and names that started with either an A or a B. He then drew net net stocks from the roughly 750 candidates left in order to put together his model portfolios.
| Portfolio 1 Price below NCAV PE floating with corporate bond yields No dividends required | Portfolio 2 Price below 85% of NCAV PE floating with corporate bond yields No dividends required |
| Portfolio 3 Price below NCAV PE of less than 5x No dividends required | Portfolio 4 Price below 85% of NCAV PE of less than 5x No dividends required |
Purchases were made based on the above criteria. Stocks were sold after a 100% gain or two years had passed, whichever resulted first. The portfolios themselves were equal weighted, so the actual yearly returns of each portfolio were just the average returns of the stocks within each portfolio.
All of the portfolios beat the indexes by a wide margin. By combining liquidation value with smaller PE ratios, however, results exploded.
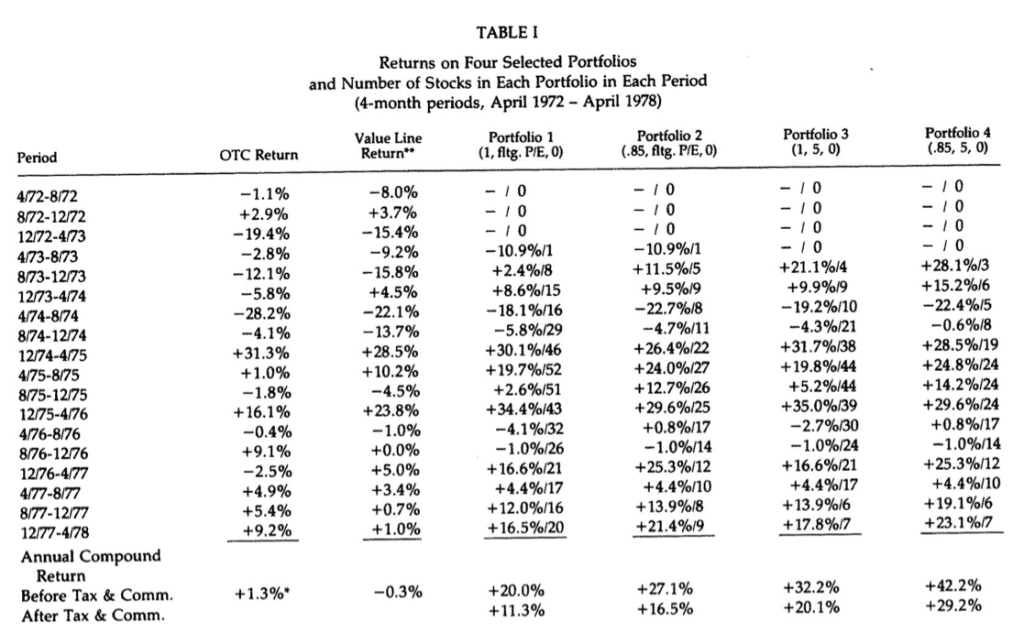
Take a look at portfolio #4. The CAGR of portfolio #4, Greenblatt's original Magic Formula, blew the market away. While the OTC CAGR totalled just 1.3% for the 6 year period, and the Value Line index came to a slight loss, Joel Greenblatt's original Magic Formula was up over 42% compounded per year from August 1973 to April 1978!
Greenblatt & Pzena broke the 6 year period up into 18 4 month periods. During that time, the market fell from 130 to 50, a decline of 61.5%! It then climbed back to just under 120, a gain of nearly 140%. But at the end of the study, the market was still underwater... but take a look at the results of the pair's net nets:
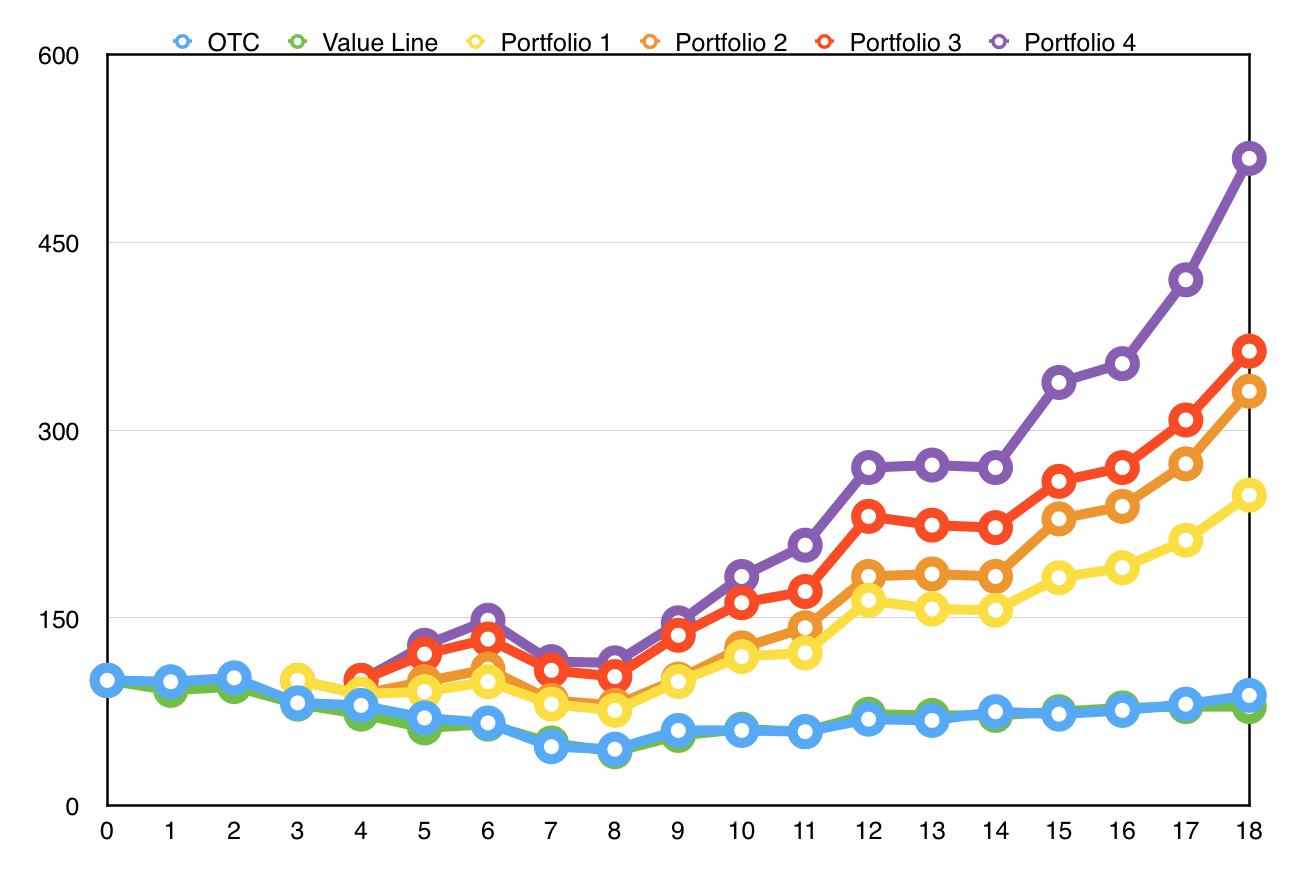
The end result for the group of net net portfolios was very good. From a starting value of 100, each ended the 6 year period before taxes and fees as follows:
Portfolio 1: 248
Portfolio 2: 331
Portfolio 3: 363
Portfolio 4: 517
As you can see, the highest quality net nets, represented by Portfolio 4, more then doubled the return of the lowest quality net nets in the study.
Greenblatt et al even included returns after commissions and taxes, for those of you who aren't holding your portfolio in a tax free retirement account for some strange reason. Re-examined, Greenblatt's best performing portfolio still destroyed the market, up over 29% versus flat returns for the indexers.
It's important to realize what this means for average investors. Since the American market indexes return roughly 10% per year on average, Greenblatt's forgotten original Magic Formula should be good for between 29% and 39% on average over the long run.
Granted, Greenblatt's study only covered a period of 6 years, but in my experience buying net net stocks with tiny PE ratios has proven to be a very profitable strategy. In fact, most of my best performing stocks have been these sort of net nets. Also keep in mind just how tumultuous the markets were during that period which, as Greenblatt wrote, made for a much more robust test.
In a recent interview at the CFA New York Society, Greenblatt recalled that he updated Graham’s net nets study and “it turned out it still worked, and I was very attracted to buying cigar butts”.
By putting together a group of stocks selling below liquidation value you’re “probably getting more than your fair share of companies that are out of favor… and you’re protecting your downside”, he said.
(As an aside: if you're stuck holding your funds outside a tax shelter, for some reason, you can boost the tax efficiency of your portfolio by just holding your stocks for longer. This becomes a lot more viable if you're investing in the highest quality net nets.)
Three Major Takeaways from Joel Greenblatt's Study
It's hard to argue with returns like that.
Still, the more observant of you might have noticed a few potential flaws with the study and results.
At first glance, it definitely appears that you can't hold a large number of stocks in a portfolio using Joel Greenblatt's criteria. If you look to the right of each period's return, you'll see exactly how many stocks he held. In fact, Greenblatt et al were out of the market entirely for a lot of 1972 and 1973.
I don't think this is a crippling flaw to his strategy at all, however.
It's important to realize that Benjamin Graham's obsession with wide diversification isn't really necessary. In Joel Greenblatt's first book, "You can Be a Stock Market Genius," he argues that you need fewer than 10 stocks to eliminate most of the systemic risk that you face while investing in stocks. Ultimately, you don't need 30 or 100 different stocks to diversify away most of your risk. You can do it with ten.
You can even leverage Greenblatt's original Magic Formula, portfolio #4, while maintaining a fully stocked portfolio during the upper reaches of a bull market. The trick is to put together a portfolio of other net net stocks and then replace the weakest links in your portfolio with a portfolio #4 type net net when new candidates become available. Doing so would allow you to leverage the returns of NCAV stocks as a group while still employing Greenblatt's original magic formula when available.
You could even chose the best net net stocks that don't meet Greenblatt's criteria by focusing on NCAV stocks that are trading at an incredibly cheap price to NCAV, have no debt, are growing NCAV per share, are buying back stock, or which have insiders who are buying big blocks of shares, themselves.
Lastly, remember that Joel Greenblatt et al only looked at companies with names that began with the letters A or B. That inevitably eliminated most net nets from contention. In my own experience, there are a lot of net net stocks available for smart investors willing to invest internationally. I screen for these using our Net Net Hunter Scorecard.
The second takeaway is that both quality and price have a major impact on returns. Looking at the results, when holding PE requirements constant, the cheaper portfolios in terms of price to NCAV outperformed the more expensive portfolioes. Likewise, when holding price to NCAV requirements constant, the portfolios that demanded more earnings for the price paid outperformed their peers. By combining both value and quality, as Greenblatt did in portfolio #4, an investor can do very well in the stock market.
Finally, it's fairly clear that Joel Greenblatt's original Magic Formula, and NCAV stocks in general, trumps Greenblatt's contemporary Magic Formula. Sure, the Magic Formula that Greenblatt champions in his latest book is a good investment strategy, on the whole, but it just doesn't live up to his forgotten original Magic Formula. While his contemporary Magic Formula was reported to return just north of 23% per year vs. the S&P 500's 9.6% return, Greenblatt's original Magic Formula spanked that return -- and did so during a flat market, as well!
In the same recent interview I mentioned earlier, referring to the strategy of buying good businesses at fair prices, Greenblatt went as far as saying that while “he’d like to own a great growth company… people think there are a lot more” of those companies than there actually are.
That’s just a way of saying not many people can actually profit from growth stocks. However, you can profit from Greenblatt’s original Magic Formula.
How I'm Leveraging Greenblatt's Original Magic Formula
As you can see, Greenblatt's original Magic Formula is magical indeed.
His study has had a huge impact on my own selection criteria. When selecting net net stocks, I look for firms that have a deep discount to NCAV but still focus on high quality situations. For example, I currently own two deeply discounted stocks based on NCAV and earnings: one trading at just over 5x earnings and just over 40% of NCAV; the other offering a PE of 6 and trading at 68% of NCAV. Joel Greenblatt would be proud.
The biggest challenge to earning 25-35% annual returns is not the actual investing -- it's finding the investment opportunities. Right now Net Net Hunter members have access to over 450 net net stocks in 5 countries, as well as Shortlists of the best possible net net stock opportunities in each country. Make the most of your time by quickly finding the best net net stocks available.
Get a free net net stock essential guide. Enter your email address in the box below.


