Are NNWC Stocks Worth Investing In?
This article was written by Net Net Hunter member Tyen Redmond (A.K.A. "The Hairy Contrarian") and may or may not reflect the thoughts of anybody else at Net Net Hunter.
Ever spot a pair of twins and, for whatever reason, one twin is substantially worse looking than the other? I bet you’d be surprised to know that net nets have an ugly sister of their own, Net Net Working Capital (or NNWC) stocks.
Net net investors always deal with stocks that are seen as ugly by the broader community. We embrace it, knowing that many of these ugly ducklings will turn into rich swans. This is why we look for the stocks that have been neglected and ignored, and are undervalued as a result.
Net nets actually come in two flavours and the more popular variant is known as Net Current Asset Value (NCAV). We all know that NCAV stocks have a history of outperforming the market. So the question then is: what is NNWC and how does it perform?
Besides being uglier, NNWC is another less well known way of calculating net-net value. However, while it’s a more stringent and time consuming approach, there’s no evidence to suggest that it’s worth the extra effort.
Confusingly, some authors and commentators refer to the result of the NCAV calculation as "net net working capital." However, in this article, NNWC refers to the following calculation:
+100% of cash and short-term investments;
+75% of accounts receivable;
+50% of inventories;
-100% of all liabilities and claims senior to the common stock.
“Claims senior to the common stock” just means items such as preferred shares that get paid during liquidation before regular shareholders get paid.
And, this calculation should be the starting point only, as the percentages outlined can be adjusted for each individual stock. While the NNWC calculation is somewhat similar to the NCAV calculation, but there is a degree of analysis and interpretation to what percentages you should apply.
So the above formula is not a ‘one-size-fits-all’ approach. Rather, it is merely a starting point if you are to strictly follow NNWC principles. Graham also included ‘Fixed and miscellaneous assets’ as part of the equation, for some reason, but there is no easily accessible explanation for why.
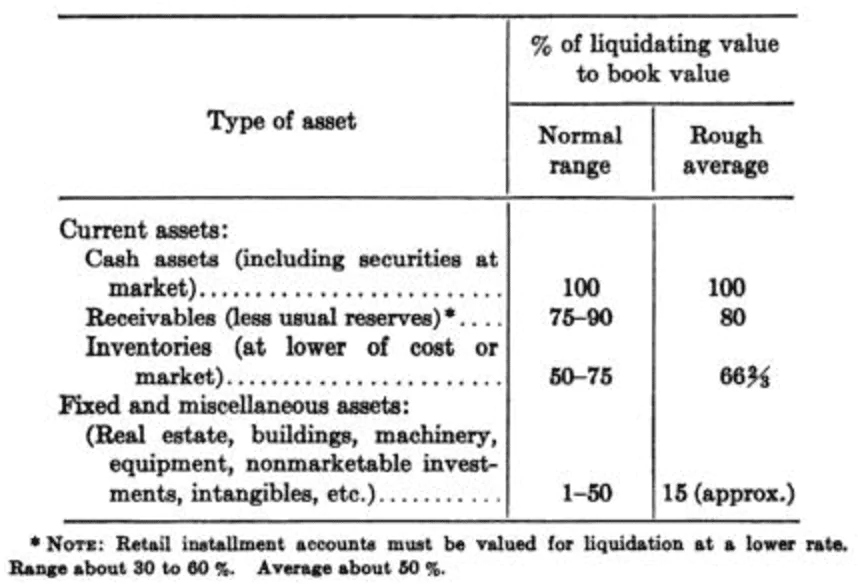
(Source: Benjamin Graham’s Classic 1934 Edition of Security Analysis)
Graham’s focus on NNWC liquidation value required greater exercise and judgement to determine how to discount each class of asset. This opens the door to errors and consequently increased risk.
NCAV investors select stocks trading below 66% of NCAV. NNWC investors look for any discount below 100% of NNWC. Naturally, a larger discount is better.
While a 1/3rd discount to intrinsic value is the minimum margin of safety for NCAV stocks, NNWC investors derive their margins of safety from discounting various asset classes. This leaves greater room for error. For example, if you discount Accounts Receivable by 75%, but later discover that the correct rate should have been 60%, you may have purchased the stock above NNWC value. That would not be ideal.
Also, as a general rule, as you move down the asset sections on the Balance Sheet the reliability of the figures reported becomes less certain. For examples, there should be 100% confidence in the cash reported on the books for obvious reasons, but the value of the inventory may fluctuate over time. So you need to be really confident in the figures and the discount you are applying in order to reach true NNWC value and a real margin of safety.
There is also growing evidence suggesting that more simplistic models, such as the NCAV calculation, are more accurate predictors than their more complex counterparts, such as the NNWC calculation. As NNWC introduces greater discretion and complexity, this increases the risk of error. This is one of the reasons why I advocate for NCAV net nets, as it takes out the guess work. It is also more useful for the same reasons.
Deep value investors are far more aware of the term NCAV than they are NNWC. This is probably due to the comparative ease of calculating NCAV and finding NCAV stocks. Of course, the praise given by luminaries such as Graham, Buffett and their contemporaries helps sponsor this approach.
In fact, in my research I was unable to find anyone who publicly stated their strict use of the NNWC approach. But, I did find two investors who used aspects of the NNWC formula in their NCAV calculations.
The infamous value investor Peter Cundill used what I would describe as a variant of both methods. In There’s Always Something To Do by Christopher Risso-Gill, Christopher describes Cundill’s approach as focusing on “current assets, taking cash and cash equivalents at full value, reducing accounts receivable for doubtful accounts, and reducing inventories to liquidation value.” This approach doesn’t lock into set percentages like NNWC, nor does it count all current assets at 100% like NCAV. Cundill used his accounting and business expertise to determine what the appropriate discount rate was.
Similarly, in the book Deep Value Investing: Finding bargain shares with big potential (a must read for all Net Het Hunter members!!), Jeroen Bos outlines his approach as NCAV in Chapter One but adjusts the current asset values in some cases. Based on his in-depth research, he both reduces and increases certain current assets where appropriate. This is another example of an NCAV investor using elements of NNWC in certain circumstances.
So, what about returns?
Jae over at Old School Value conducted a number of great backtests. The first looks at the S&P 500 Index, NCAV, NNWC, and what he calls NNWC Increasing. He describes the latter being where NNWC “is positive and ... has increased compared to the previous quarter.” Also, these stocks did not need the NNWC figure to be below the current Market Capitalisation. Jae’s study also only looks at the period from 2007 to 2009. Noting these limitations, what it finds is that NNWC and NNWC Increasing have very good results for both 10 and 15 stock portfolios, but NCAV stocks really lag behind. Take a look:
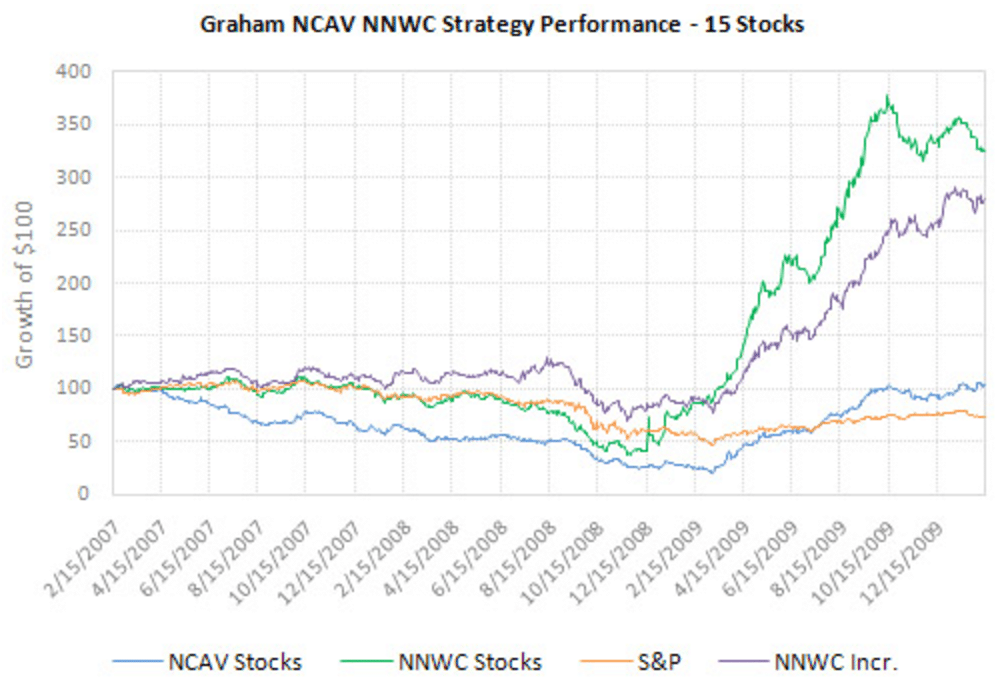
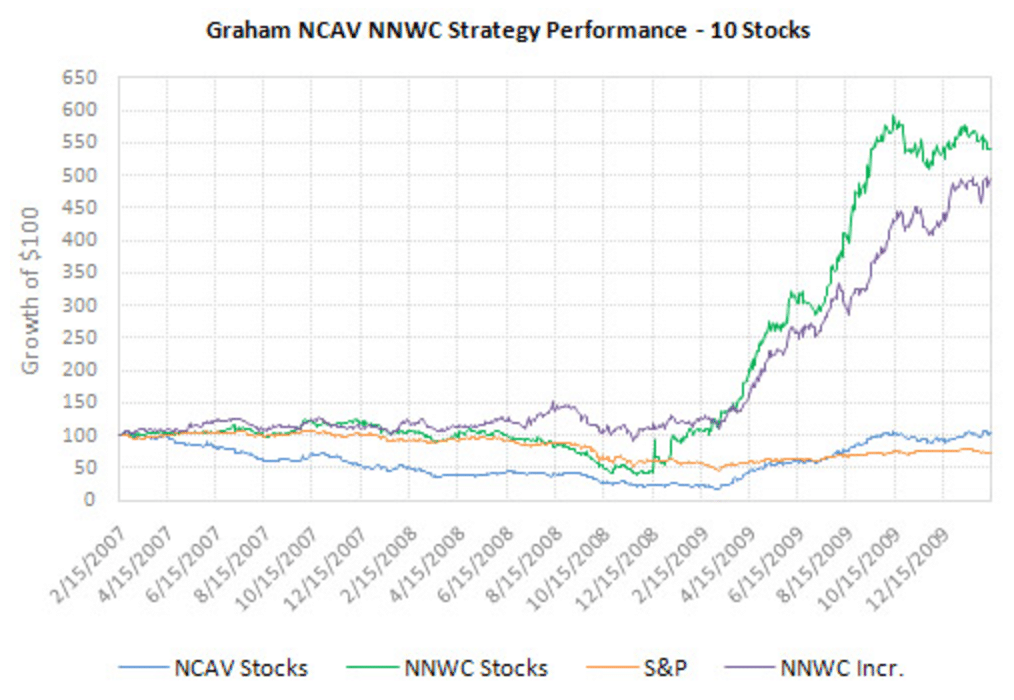
With these returns, $100 invested ended up as:
| Portfolio | NNWC | NNWC Increasing | NCAV | S&P500 |
| 15 Stock | $328 | $283 | $105 | $74 |
| 10 Stock | $544 | $503 | $103 | $74 |
Shocking results, given the commentary above. But, Jae missed something important. All NCAV investors should demand a minimum 1/3rd margin of safety when buying a stock. Jae’s first test omitted this requirement. What would have happened if Jae included a minimum margin of safety?
Luckily, Jae fixed the error in a second backtest, and demanded a 1/3rd discount to NCAV. His study also covered a more substantial period of 10 years. The results were very surprising. Jae found that NCAV outperformed from 2001-2004, NNWC outperformed from 2004-2007, and the results were even for 2007-2010. Here are the results in further detail:
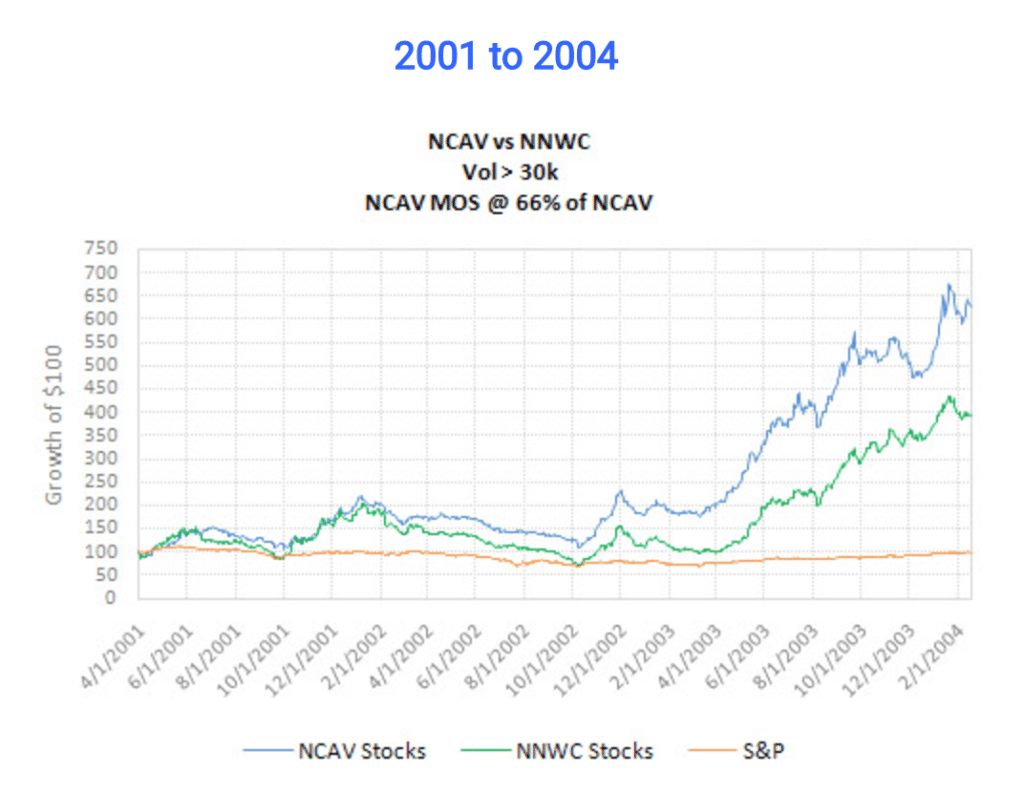
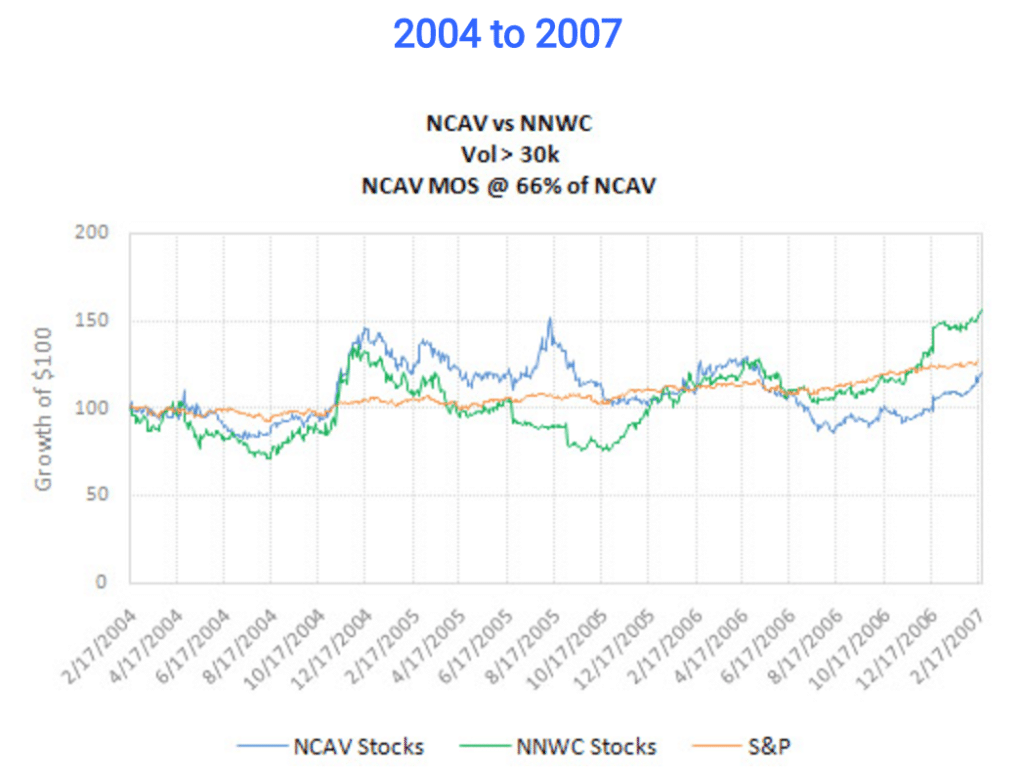
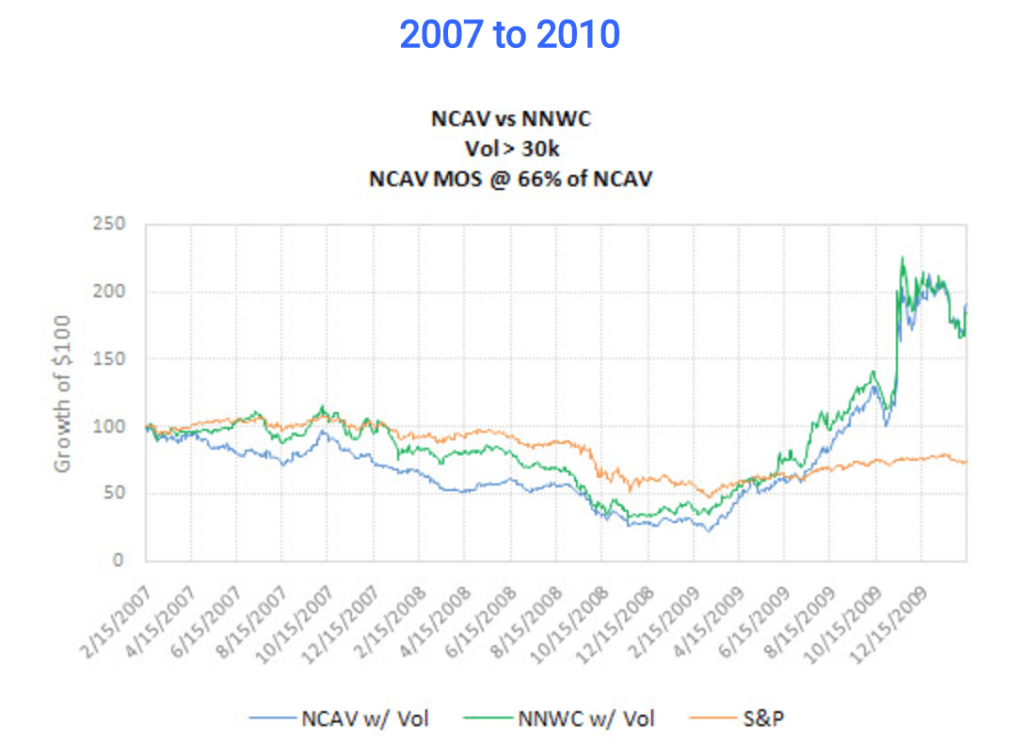
Quickly eyeing these charts, the returns are indeed close. Still, the NCAV portfolio, which this time included a proper margin of safety, edges out the NNWC portfolio over the 8 and ½ year period.
At this point, you’re probably not surprised to hear that I’m not a big fan of assessing liquidation value using NNWC. The higher thresholds and the increased risk of error if you choose to adjust the discount rate for the assets makes the approach more time consuming and prone to mistakes.
Yes, you could demand a 1/3rd discount to NNWC to combat this uncertainty; but, you could also demand an even further discount to NCAV, as well.
The simple NCAV approach is easier and, as the research shows, simple approaches generally achieve better results. The lack of research and information on NNWC compared to NCAV reinforces its status as the uglier of two ugly sisters.
You could employ the tactics of Cundill and Bos by varying current asset accounts as appropriate, but do this at your own peril. Stick within your circle of competence and don’t use this as a substitute for an adequate margin of safety.
You can always use NNWC as an alternative approach, but make sure you comprehensibly research and analyse the Balance Sheets you are looking at.
For me, I’m going to continue to trust the research and use NCAV as my primary approach. The results continue to speak for themselves.
It took me years to realize just how good Graham's original net net stock strategy was - don't make that same mistake. Join now so you can start earning 25%+ compounded annually per year. Click Here
